


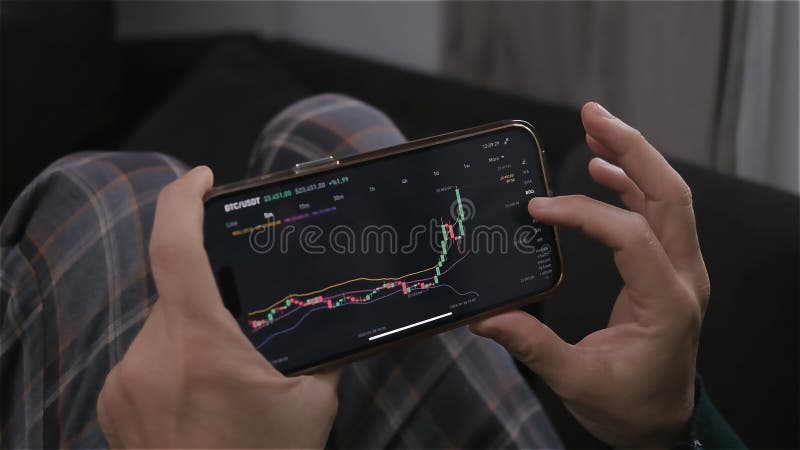
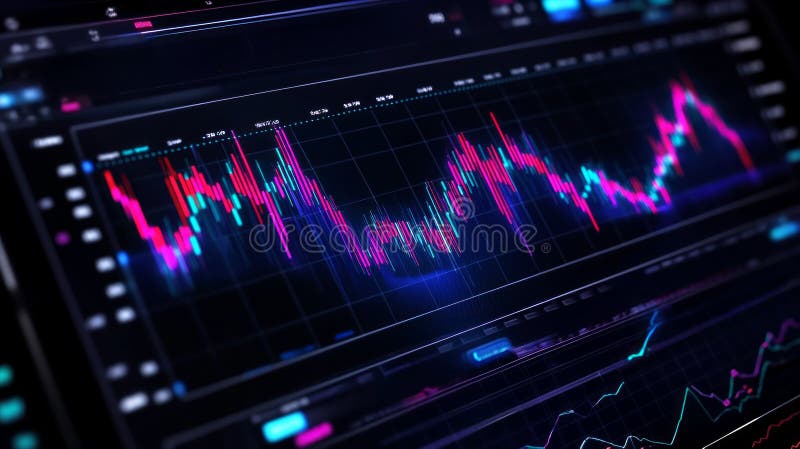
This image showcases a close-up view of a computer screen displaying red candlestick patterns while analyzing trading charts in the stock market. The red candlestick patterns convey the theme of a bearish market trend, indicating a potential decline in stock prices. The image highlights the importance of technical analysis in stock trading, where traders utilize chart patterns to make informed decisions. The candlestick chart is a popular tool used by traders to identify market trends and patterns. The image emphasizes the need for traders to stay updated with market trends and analyze data to make profitable investment decisions.
圖片編號:
311464203
拍攝者:
Ftftnote213
點數下載
| 授權類型 | 尺寸 | 像素 | 格式 | 點數 | |
|---|---|---|---|---|---|
| 標準授權 | XS | 480 x 269 | JPG | 13 | |
| 標準授權 | S | 800 x 448 | JPG | 15 | |
| 標準授權 | M | 2313 x 1296 | JPG | 18 | |
| 標準授權 | L | 2986 x 1673 | JPG | 20 | |
| 標準授權 | XL | 3778 x 2117 | JPG | 22 | |
| 標準授權 | MAX | 8736 x 4896 | JPG | 23 | |
| 標準授權 | TIFF | 12355 x 6924 | TIF | 39 | |
| 進階授權 | WEL | 8736 x 4896 | JPG | 88 | |
| 進階授權 | PEL | 8736 x 4896 | JPG | 88 | |
| 進階授權 | UEL | 8736 x 4896 | JPG | 88 |
XS
S
M
L
XL
MAX
TIFF
WEL
PEL
UEL
| 標準授權 | 480 x 269 px | JPG | 13 點 |
| 標準授權 | 800 x 448 px | JPG | 15 點 |
| 標準授權 | 2313 x 1296 px | JPG | 18 點 |
| 標準授權 | 2986 x 1673 px | JPG | 20 點 |
| 標準授權 | 3778 x 2117 px | JPG | 22 點 |
| 標準授權 | 8736 x 4896 px | JPG | 23 點 |
| 標準授權 | 12355 x 6924 px | TIF | 39 點 |
| 進階授權 | 8736 x 4896 px | JPG | 88 點 |
| 進階授權 | 8736 x 4896 px | JPG | 88 點 |
| 進階授權 | 8736 x 4896 px | JPG | 88 點 |


 +886-2-8978-1616
 +886-2-2078-5115