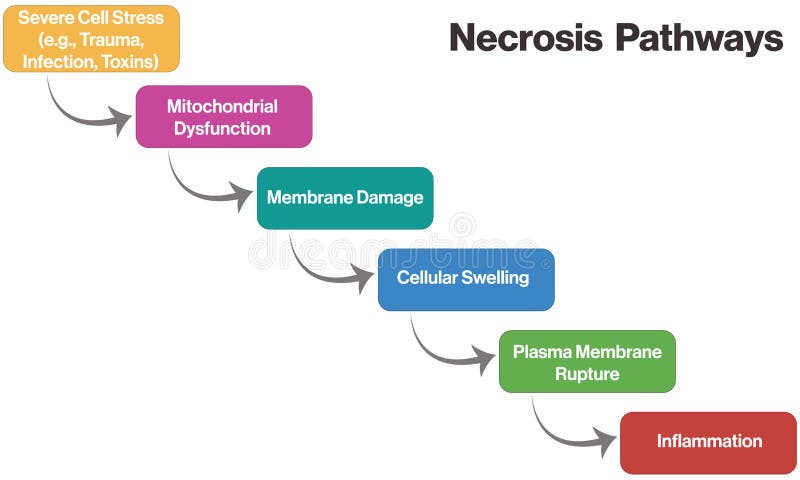
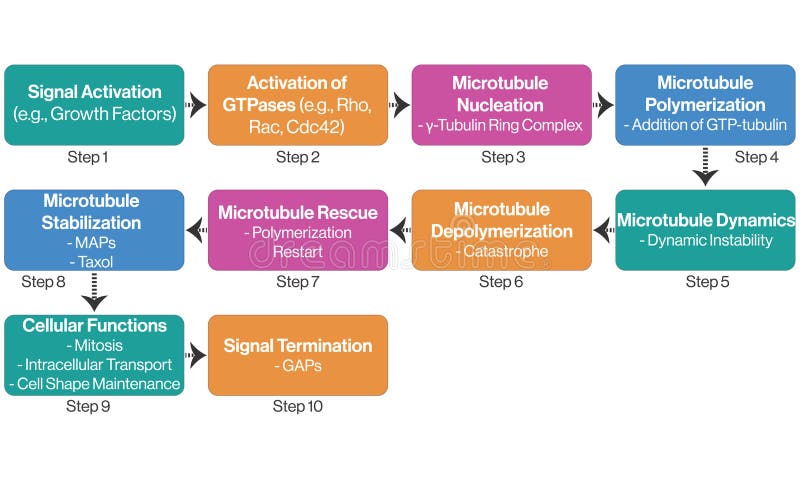
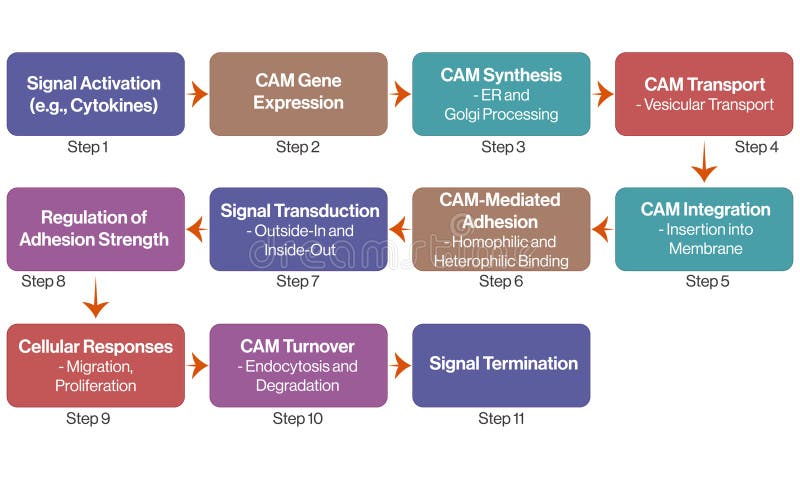
This vector illustration features a comprehensive flowchart of cell migration, designed with a white background for clarity. It illustrates the cellular migration process, highlighting key mechanisms and pathways involved. Ideal for cellular biology studies, research presentations, and educational resources, this diagram provides a clear and detailed visual representation of how cells move within biological systems. Suitable for textbooks, scientific papers, and classroom materials, it serves as an essential tool for understanding and teaching the dynamics of cell migration.
圖片編號:
326803082
拍攝者:
Slikhitha02
點數下載
| 授權類型 | 尺寸 | 像素 | 格式 | 點數 | |
|---|---|---|---|---|---|
| 標準授權 | XS | 480 x 288 | JPG | 13 | |
| 標準授權 | S | 800 x 480 | JPG | 15 | |
| 標準授權 | M | 2236 x 1341 | JPG | 18 | |
| 標準授權 | L | 2886 x 1732 | JPG | 20 | |
| 標準授權 | XL | 3651 x 2190 | JPG | 22 | |
| 標準授權 | MAX | 5000 x 3000 | JPG | 23 | |
| 標準授權 | ADD | Vector | AI | 38 | |
| 標準授權 | TIFF | 7071 x 4243 | TIF | 39 | |
| 進階授權 | WEL | 5000 x 3000 | JPG | 88 | |
| 進階授權 | PEL | 5000 x 3000 | JPG | 88 | |
| 進階授權 | UEL | 5000 x 3000 | JPG | 88 |
XS
S
M
L
XL
MAX
ADD
TIFF
WEL
PEL
UEL
| 標準授權 | 480 x 288 px | JPG | 13 點 |
| 標準授權 | 800 x 480 px | JPG | 15 點 |
| 標準授權 | 2236 x 1341 px | JPG | 18 點 |
| 標準授權 | 2886 x 1732 px | JPG | 20 點 |
| 標準授權 | 3651 x 2190 px | JPG | 22 點 |
| 標準授權 | 5000 x 3000 px | JPG | 23 點 |
| 標準授權 | Vector px | AI | 38 點 |
| 標準授權 | 7071 x 4243 px | TIF | 39 點 |
| 進階授權 | 5000 x 3000 px | JPG | 88 點 |
| 進階授權 | 5000 x 3000 px | JPG | 88 點 |
| 進階授權 | 5000 x 3000 px | JPG | 88 點 |


 +886-2-8978-1616
 +886-2-2078-5115


