


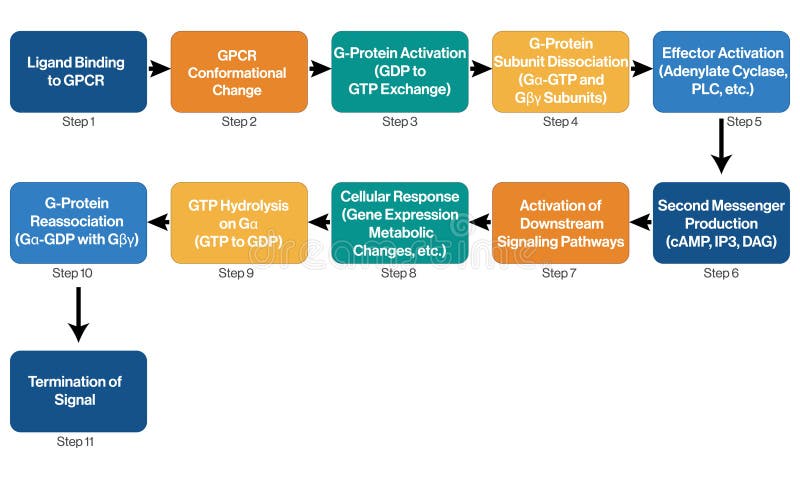
This vector illustration presents an informative flowchart of G-Protein Coupled Receptor (GPCR) signaling processes, set on a clean white background. The visual details the key steps in GPCR signaling, from receptor activation through signal transduction pathways. Designed for clarity and educational use, this flowchart helps illustrate the intricate mechanisms of GPCR function and their impact on cellular signaling and response.
圖片編號:
327086409
拍攝者:
Slikhitha02
點數下載
| 授權類型 | 尺寸 | 像素 | 格式 | 點數 | |
|---|---|---|---|---|---|
| 標準授權 | XS | 480 x 288 | JPG | 13 | |
| 標準授權 | S | 800 x 480 | JPG | 15 | |
| 標準授權 | M | 2236 x 1341 | JPG | 18 | |
| 標準授權 | L | 2886 x 1732 | JPG | 20 | |
| 標準授權 | XL | 3651 x 2190 | JPG | 22 | |
| 標準授權 | MAX | 5000 x 3000 | JPG | 23 | |
| 標準授權 | ADD | Vector | AI | 38 | |
| 標準授權 | TIFF | 7071 x 4243 | TIF | 39 | |
| 進階授權 | WEL | 5000 x 3000 | JPG | 88 | |
| 進階授權 | PEL | 5000 x 3000 | JPG | 88 | |
| 進階授權 | UEL | 5000 x 3000 | JPG | 88 |
XS
S
M
L
XL
MAX
ADD
TIFF
WEL
PEL
UEL
| 標準授權 | 480 x 288 px | JPG | 13 點 |
| 標準授權 | 800 x 480 px | JPG | 15 點 |
| 標準授權 | 2236 x 1341 px | JPG | 18 點 |
| 標準授權 | 2886 x 1732 px | JPG | 20 點 |
| 標準授權 | 3651 x 2190 px | JPG | 22 點 |
| 標準授權 | 5000 x 3000 px | JPG | 23 點 |
| 標準授權 | Vector px | AI | 38 點 |
| 標準授權 | 7071 x 4243 px | TIF | 39 點 |
| 進階授權 | 5000 x 3000 px | JPG | 88 點 |
| 進階授權 | 5000 x 3000 px | JPG | 88 點 |
| 進階授權 | 5000 x 3000 px | JPG | 88 點 |


 +886-2-8978-1616
 +886-2-2078-5115