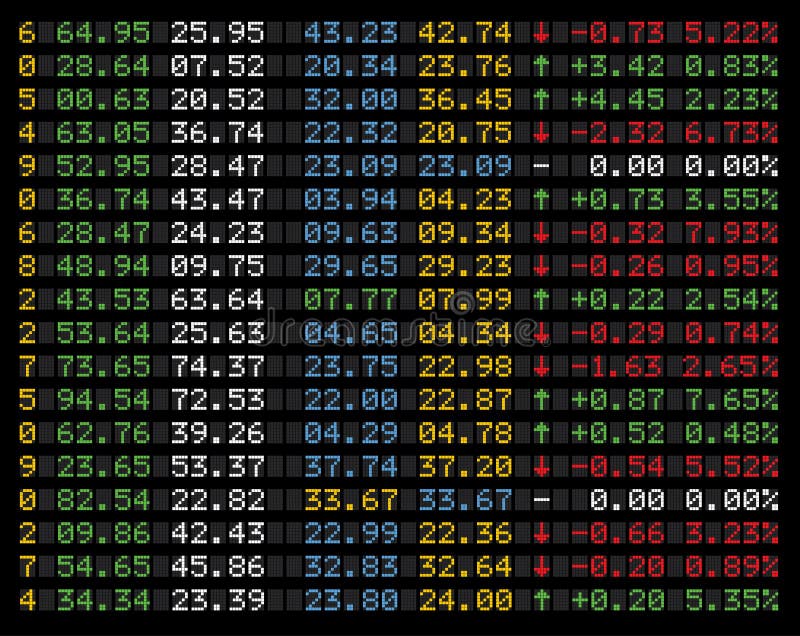
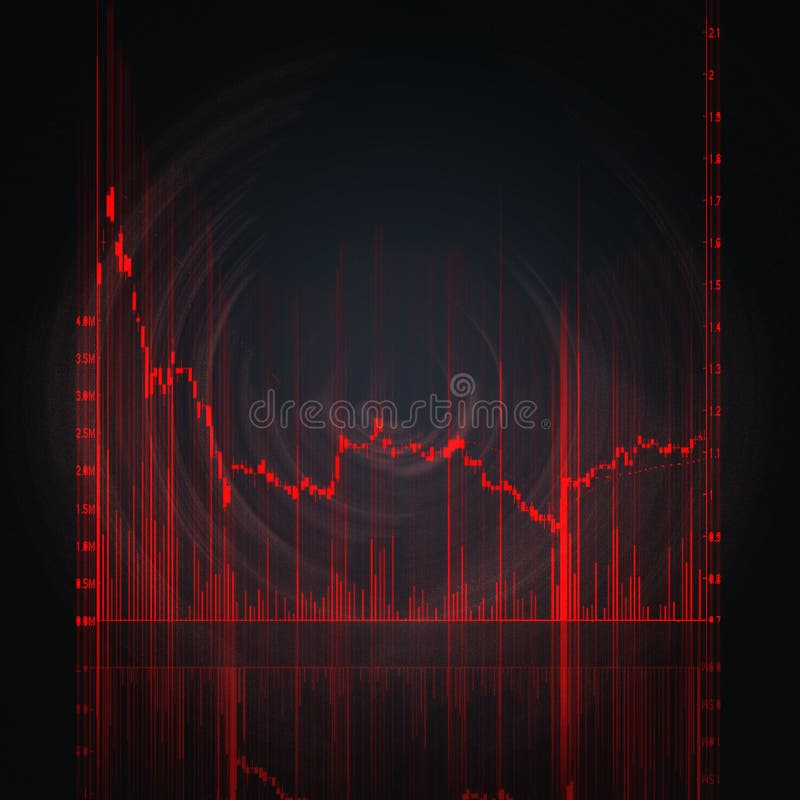
This abstract design depicts the complexity of the stock market through a series of intersecting lines and curves. The use of contrasting colors and intricate patterns symbolizes the fluctuating nature of financial data analysis. The graph represents the dynamic relationship between various economic factors, such as supply and demand, interest rates, and geopolitical events. This image is perfect for presentations, reports, and articles related to finance, economics, and business. The design captures the essence of the stock market, conveying its unpredictability and potential for growth.
圖片編號:
339047954
拍攝者:
Ftftnote213
點數下載
| 授權類型 | 尺寸 | 像素 | 格式 | 點數 | |
|---|---|---|---|---|---|
| 標準授權 | XS | 480 x 320 | JPG | 13 | |
| 標準授權 | S | 800 x 533 | JPG | 15 | |
| 標準授權 | M | 2121 x 1414 | JPG | 18 | |
| 標準授權 | L | 2738 x 1825 | JPG | 20 | |
| 標準授權 | XL | 3463 x 2309 | JPG | 22 | |
| 標準授權 | MAX | 7168 x 4779 | JPG | 23 | |
| 標準授權 | TIFF | 10137 x 6759 | TIF | 39 | |
| 進階授權 | WEL | 7168 x 4779 | JPG | 88 | |
| 進階授權 | PEL | 7168 x 4779 | JPG | 88 | |
| 進階授權 | UEL | 7168 x 4779 | JPG | 88 |
XS
S
M
L
XL
MAX
TIFF
WEL
PEL
UEL
| 標準授權 | 480 x 320 px | JPG | 13 點 |
| 標準授權 | 800 x 533 px | JPG | 15 點 |
| 標準授權 | 2121 x 1414 px | JPG | 18 點 |
| 標準授權 | 2738 x 1825 px | JPG | 20 點 |
| 標準授權 | 3463 x 2309 px | JPG | 22 點 |
| 標準授權 | 7168 x 4779 px | JPG | 23 點 |
| 標準授權 | 10137 x 6759 px | TIF | 39 點 |
| 進階授權 | 7168 x 4779 px | JPG | 88 點 |
| 進階授權 | 7168 x 4779 px | JPG | 88 點 |
| 進階授權 | 7168 x 4779 px | JPG | 88 點 |


 +886-2-8978-1616
 +886-2-2078-5115


